




Air Quality Monitoring Of A Certain Garbage Dump
更新时间: 2026年5月28日 点击次数:16290
Air Quality Monitoring Of A Certain Garbage Dump
1. Project Overview
Install an air monitoring station at the project site to collect six indicators of air quality pollutants, including nitrogen dioxide (NO2), carbon monoxide (CO), ozone (O3), sulfur dioxide (SO2), inhalable particulate matter (PM10), and fine particulate matter (PM2.5), every minute for long-term real-time monitoring.
2. Monitoring content
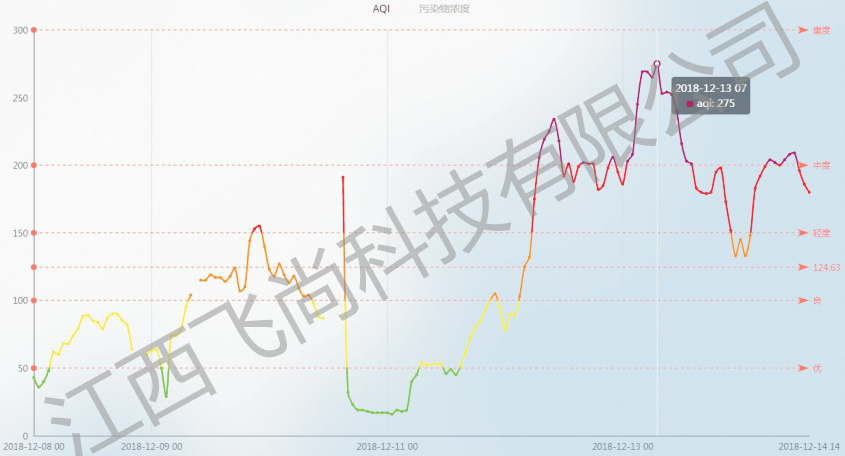
From the data graph on the platform in the right figure, it can be seen that the average range of the air quality index (AQI) at the monitoring point of this project is 16-275, with a weekly average of 125, and the AQI reached its peak at 275 at 7:00 am on December 13th.
III. Monitoring significance
(1) For smart environmental monitoring, breaking down information silos and achieving mutual integration and sharing of monitoring data.
(2) Big data is no longer simply emphasizing large amounts of data, but placing greater emphasis on a wide range of data sources and dimensions.
(3) Integrate and analyze multidimensional data from national and provincial monitoring stations, smart construction site dust monitoring, and smart environmental protection grid monitoring stations to achieve precise and precise environmental quality control and governance.
(4) Our company regularly organizes expert data analysis meetings to analyze the changing trends of abnormal data; And provide daily/weekly/monthly professional monitoring data report push; Ensure that customers are informed of the monitoring environment status in a timely manner and take timely and effective response measures.
Install an air monitoring station at the project site to collect six indicators of air quality pollutants, including nitrogen dioxide (NO2), carbon monoxide (CO), ozone (O3), sulfur dioxide (SO2), inhalable particulate matter (PM10), and fine particulate matter (PM2.5), every minute for long-term real-time monitoring.
2. Monitoring content
From the data graph on the platform in the right figure, it can be seen that the average range of the air quality index (AQI) at the monitoring point of this project is 16-275, with a weekly average of 125, and the AQI reached its peak at 275 at 7:00 am on December 13th.
III. Monitoring significance
(1) For smart environmental monitoring, breaking down information silos and achieving mutual integration and sharing of monitoring data.
(2) Big data is no longer simply emphasizing large amounts of data, but placing greater emphasis on a wide range of data sources and dimensions.
(3) Integrate and analyze multidimensional data from national and provincial monitoring stations, smart construction site dust monitoring, and smart environmental protection grid monitoring stations to achieve precise and precise environmental quality control and governance.
(4) Our company regularly organizes expert data analysis meetings to analyze the changing trends of abnormal data; And provide daily/weekly/monthly professional monitoring data report push; Ensure that customers are informed of the monitoring environment status in a timely manner and take timely and effective response measures.